
Know the second a machine stops.
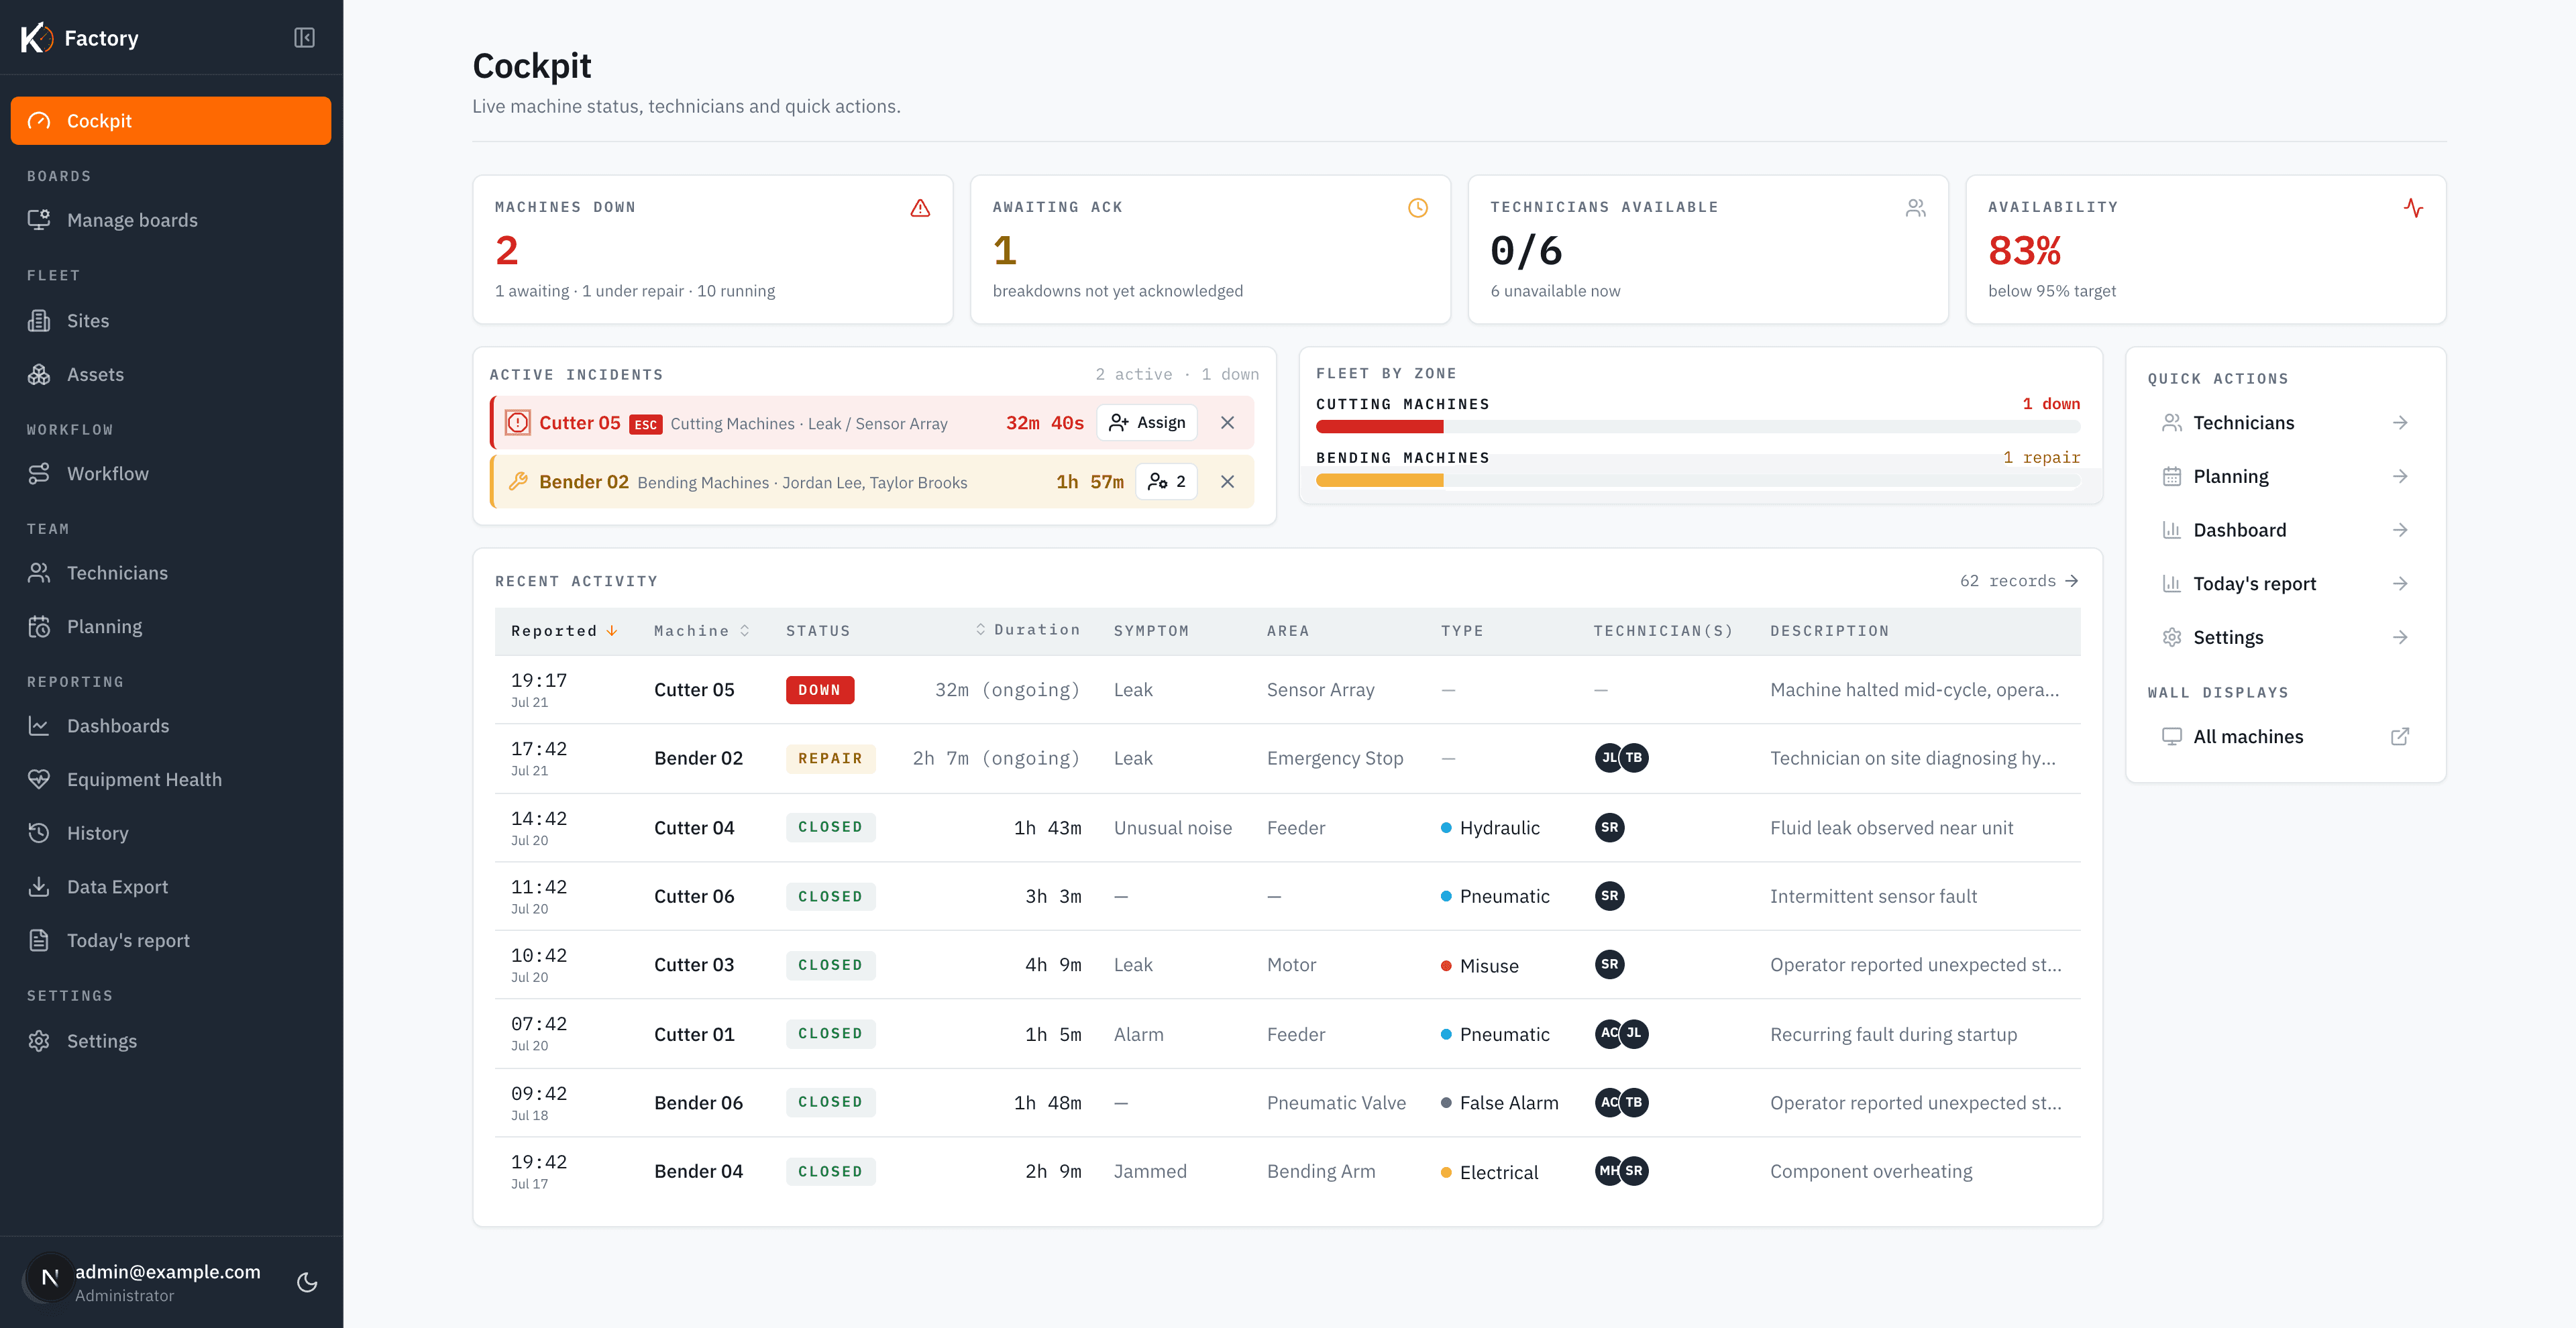
Karios is the andon layer for your plant floor. An operator declares a breakdown in one tap. The right available technician is paged automatically. Every stop gets timed and attributed without anyone filling in a form.
You already know downtime is expensive. You probably know by about half.
An hour of stopped production is six costs, not one. Most plants track the two that show up on an invoice: the margin they did not earn, and the emergency call-out they paid for. The other four get carried without anyone putting a number on them.
Getting that number is not an accounting exercise. It only exists if every stop was timed and attributed while it was happening.
50% of what most plants count
50% usually goes unmeasured
- Lost margin
- 32%
- Emergency maintenance
- 18%
- Scrap & restart
- 15%
- Overtime labour
- 15%
- Logistics impact
- 12%
- Idle energy
- 8%
Cost anatomy after TeepTrak's six-category downtime framework. Shares are theirs, not a Karios measurement. Treat them as a checklist for your own finance team rather than as your numbers.
One credible figure beats ten benchmarks.
Nobody funds a project off an industry average. They fund it off one number from their own plant: what an hour costs here, times how often it happened last year. Four inputs, and the result is yours to take into the room.
Ask finance, don't estimate. Lost margin plus what the stop costs you directly.
Across the machines you'd put on Karios. Last full year, not a good year.
From the machine stopping to it running again.
From the machine stopping to someone qualified standing at it.
If you don't know a number
The hourly cost is the one worth getting right, and it is the one nobody on the floor has. Finance can usually produce it from contribution margin per unit and rated throughput. The other three are the ones a plant guesses at, which is rather the point of measuring them.
Guess for now. You can bring the real figures to the call.
Unplanned downtime, per year
$960,000
240 hours stopped, at your own hourly figure. This is arithmetic on the numbers you just typed, not a projection.
If that hourly figure only covers lost margin and emergency maintenance, which is what most plants track, the fully loaded cost is closer to $1,920,000. Estimated by scaling to the six-part cost anatomy below, where those two components are 50% of the total.
The part Karios touches
Karios does not make a repair faster. It removes the gap before the repair starts: the 44 hours a year your machines spend stopped and waiting for someone to arrive.
Your assumption, not our claim. Move it to whatever you actually believe.
Recoverable on your own assumption
$88,000 / year
Three moves, and only one of them involves typing.
One system, read three completely different ways.
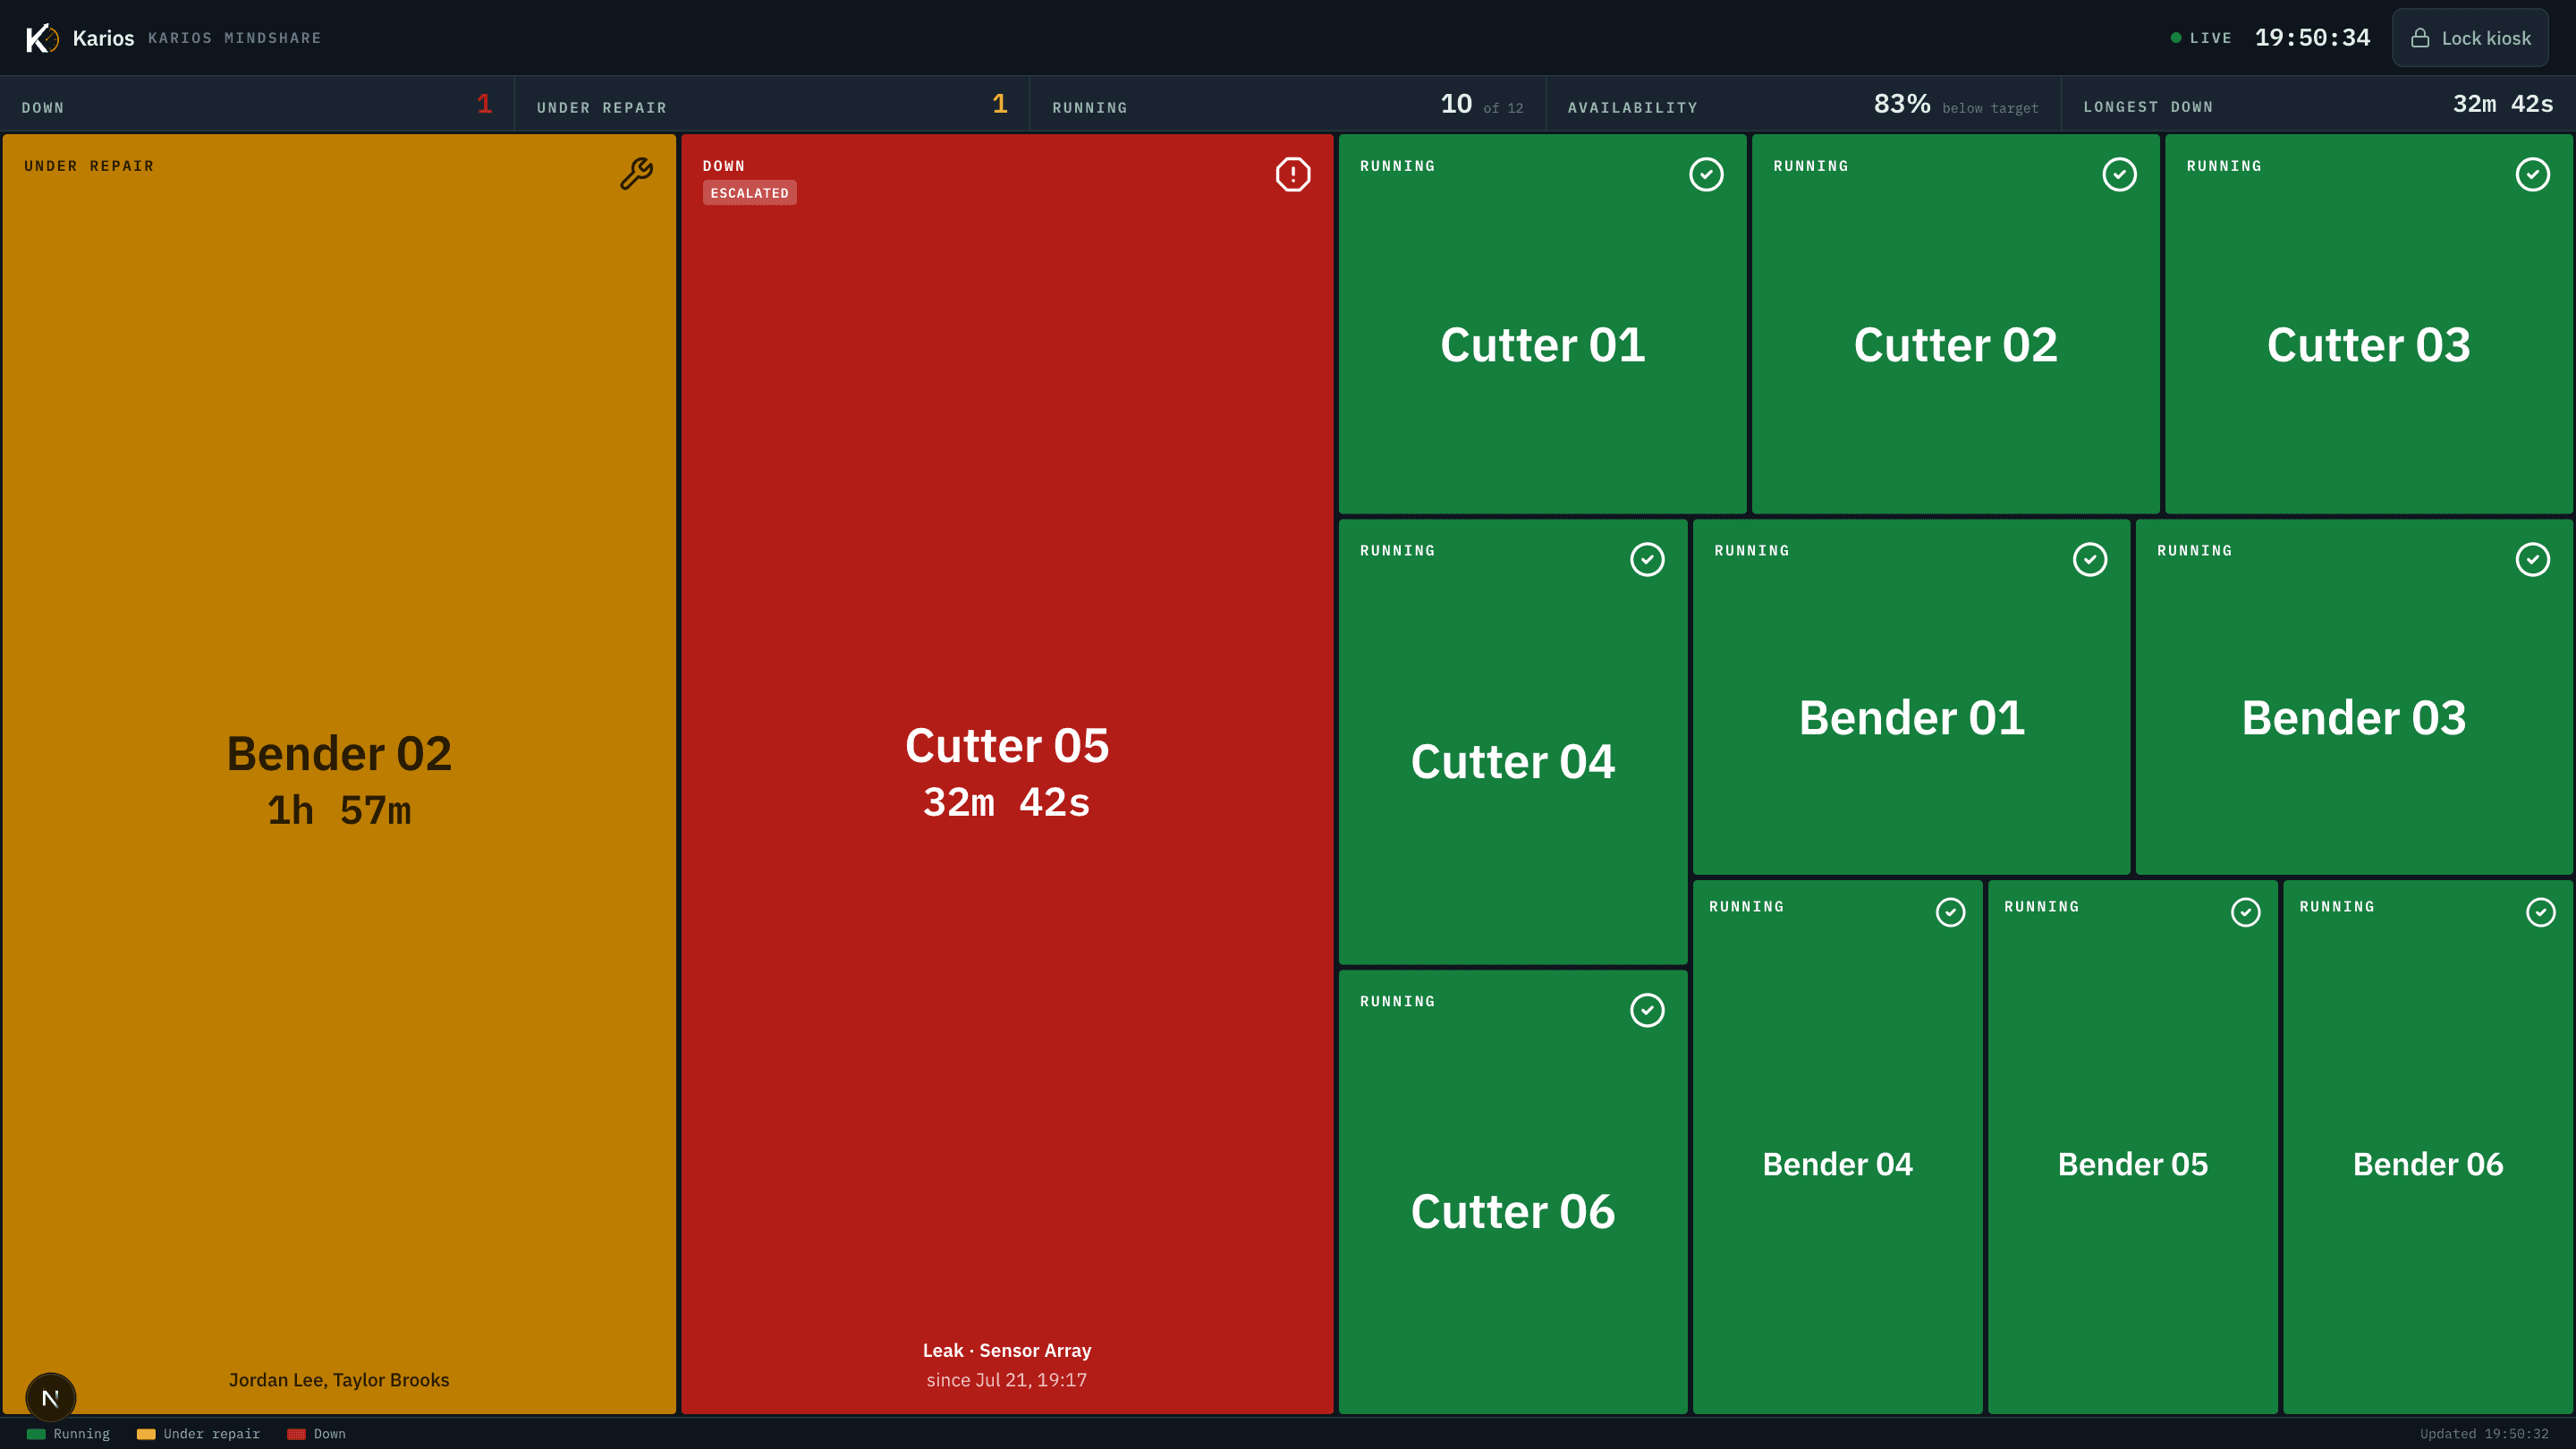
A wallboard scanned from ten metres, a panel poked at with gloves on, and a manager at a desk are not the same screen made bigger. Each surface is built for its own distance. All three describe the same live state.
The machine panel
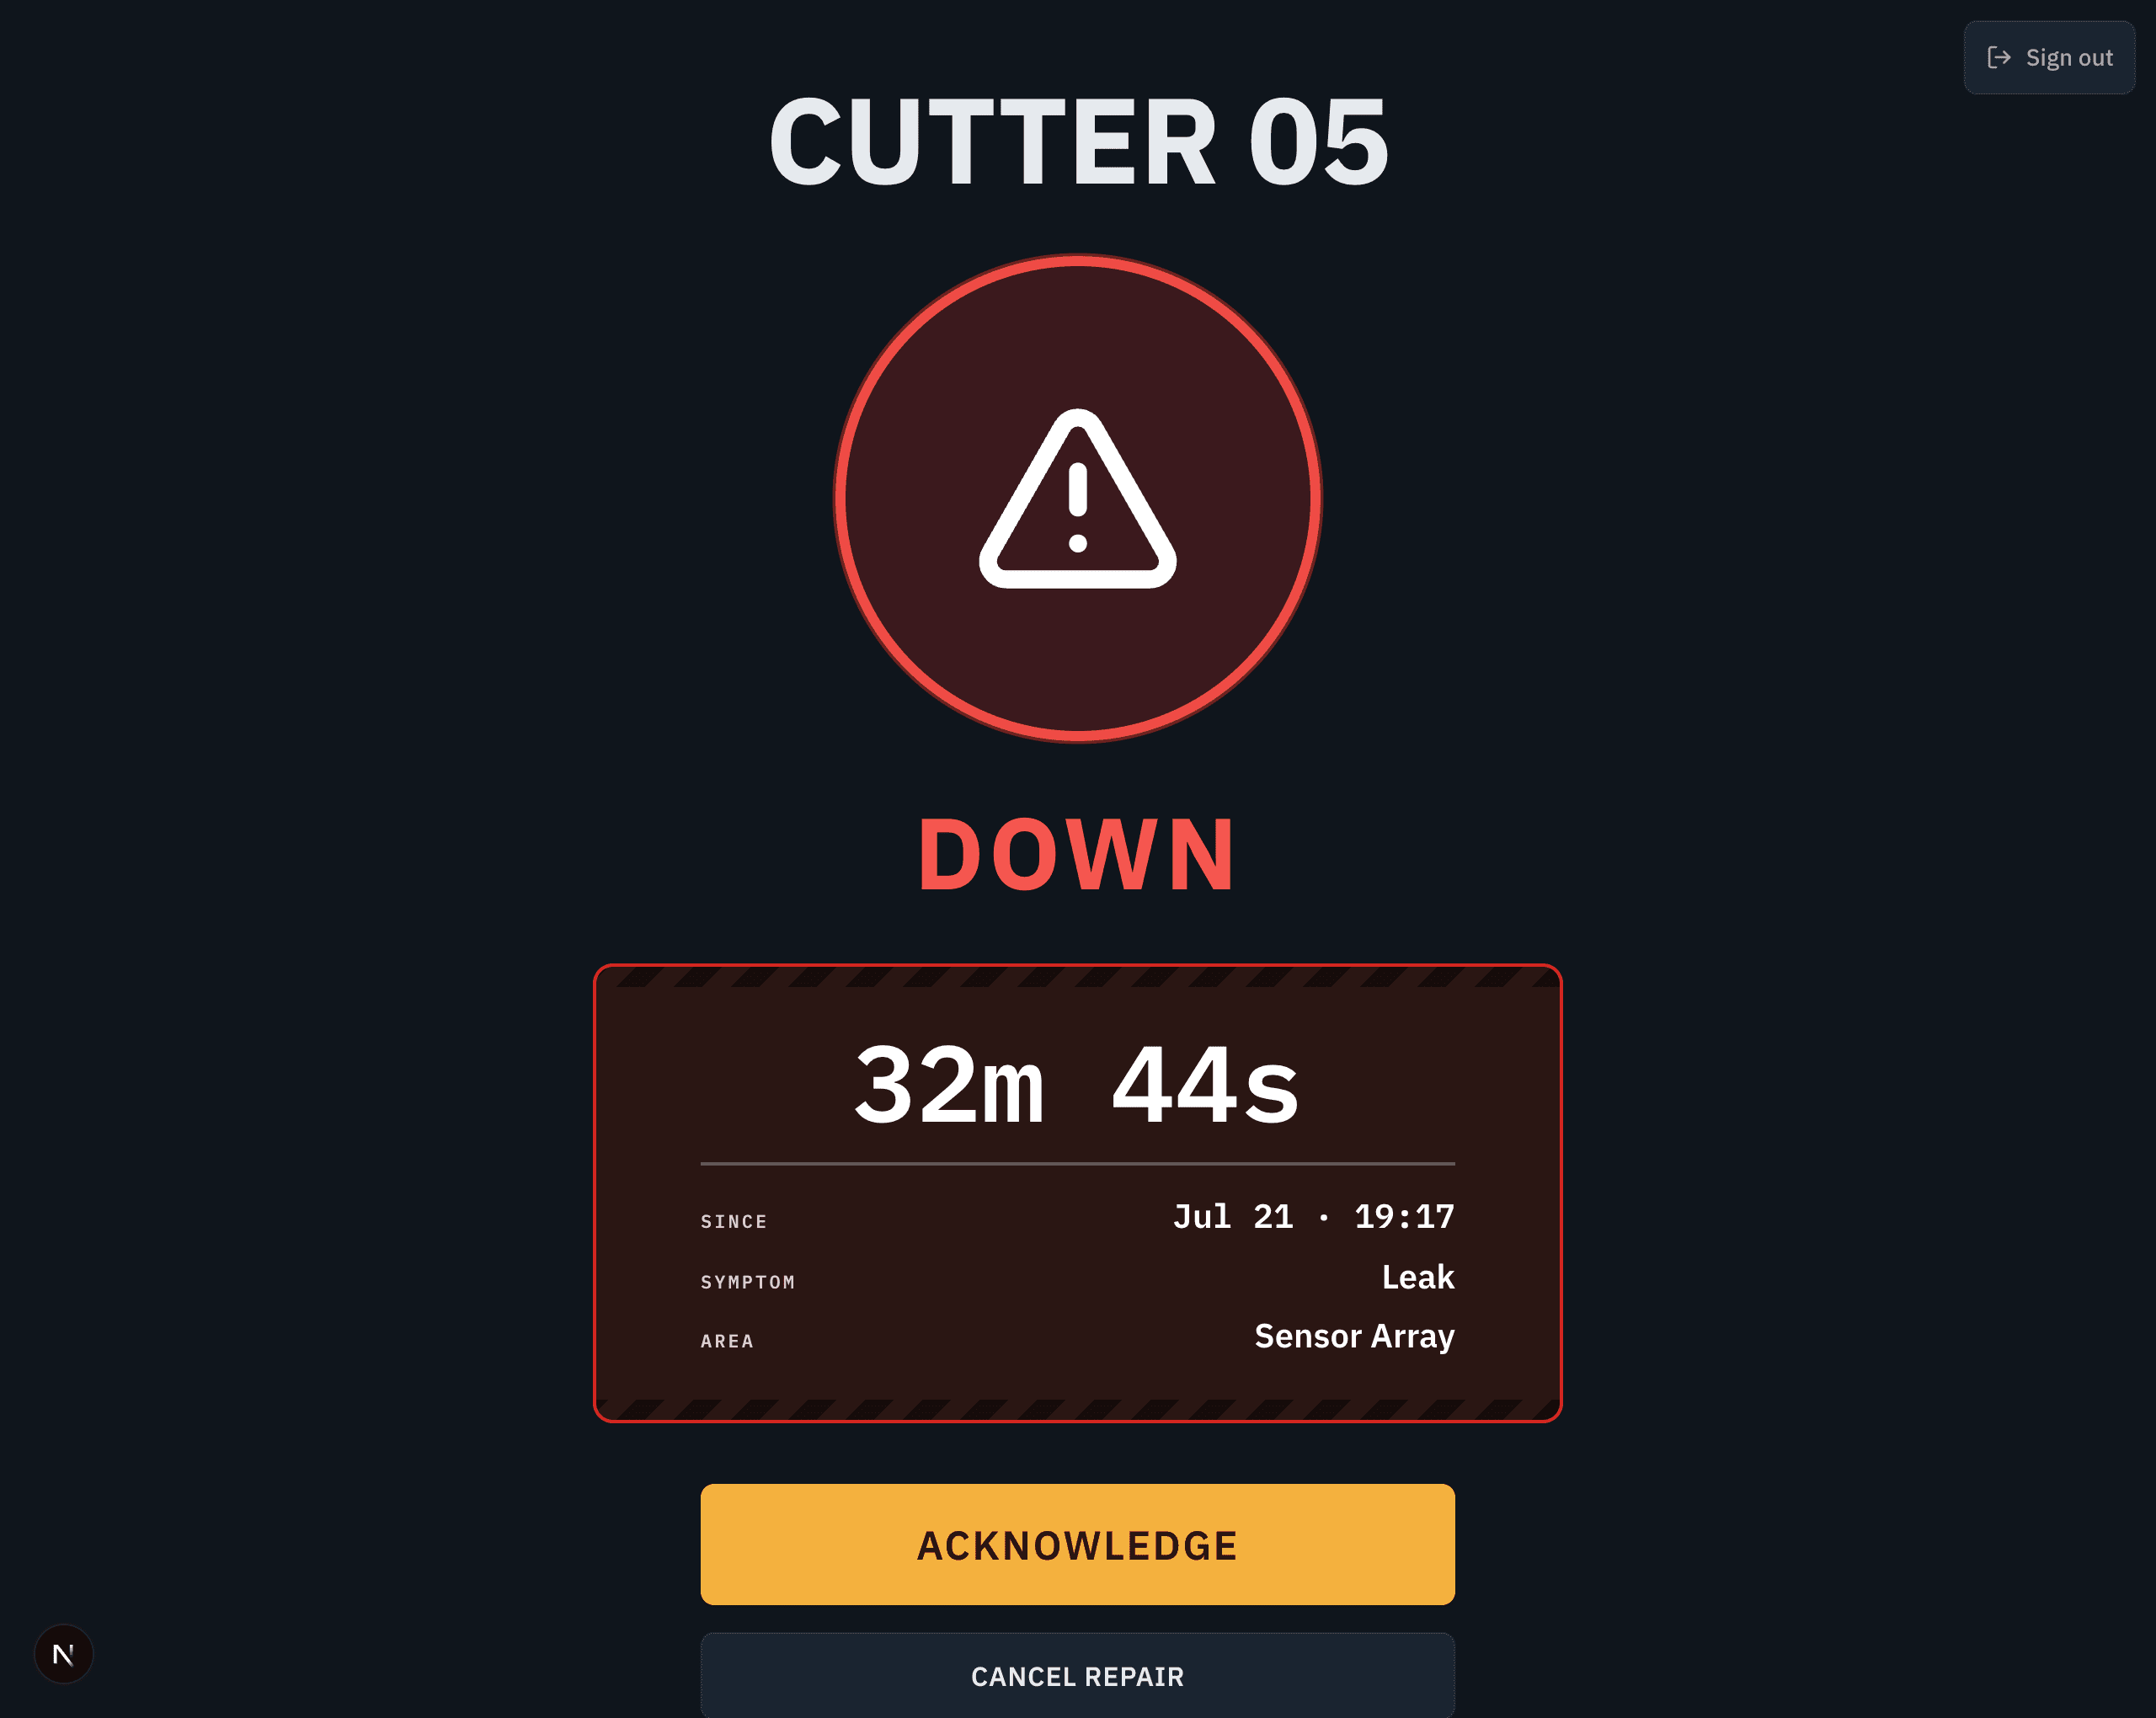
A touch panel at the machine, sized for gloved fingers. Declare, acknowledge, close. Nothing else on the screen.
The record
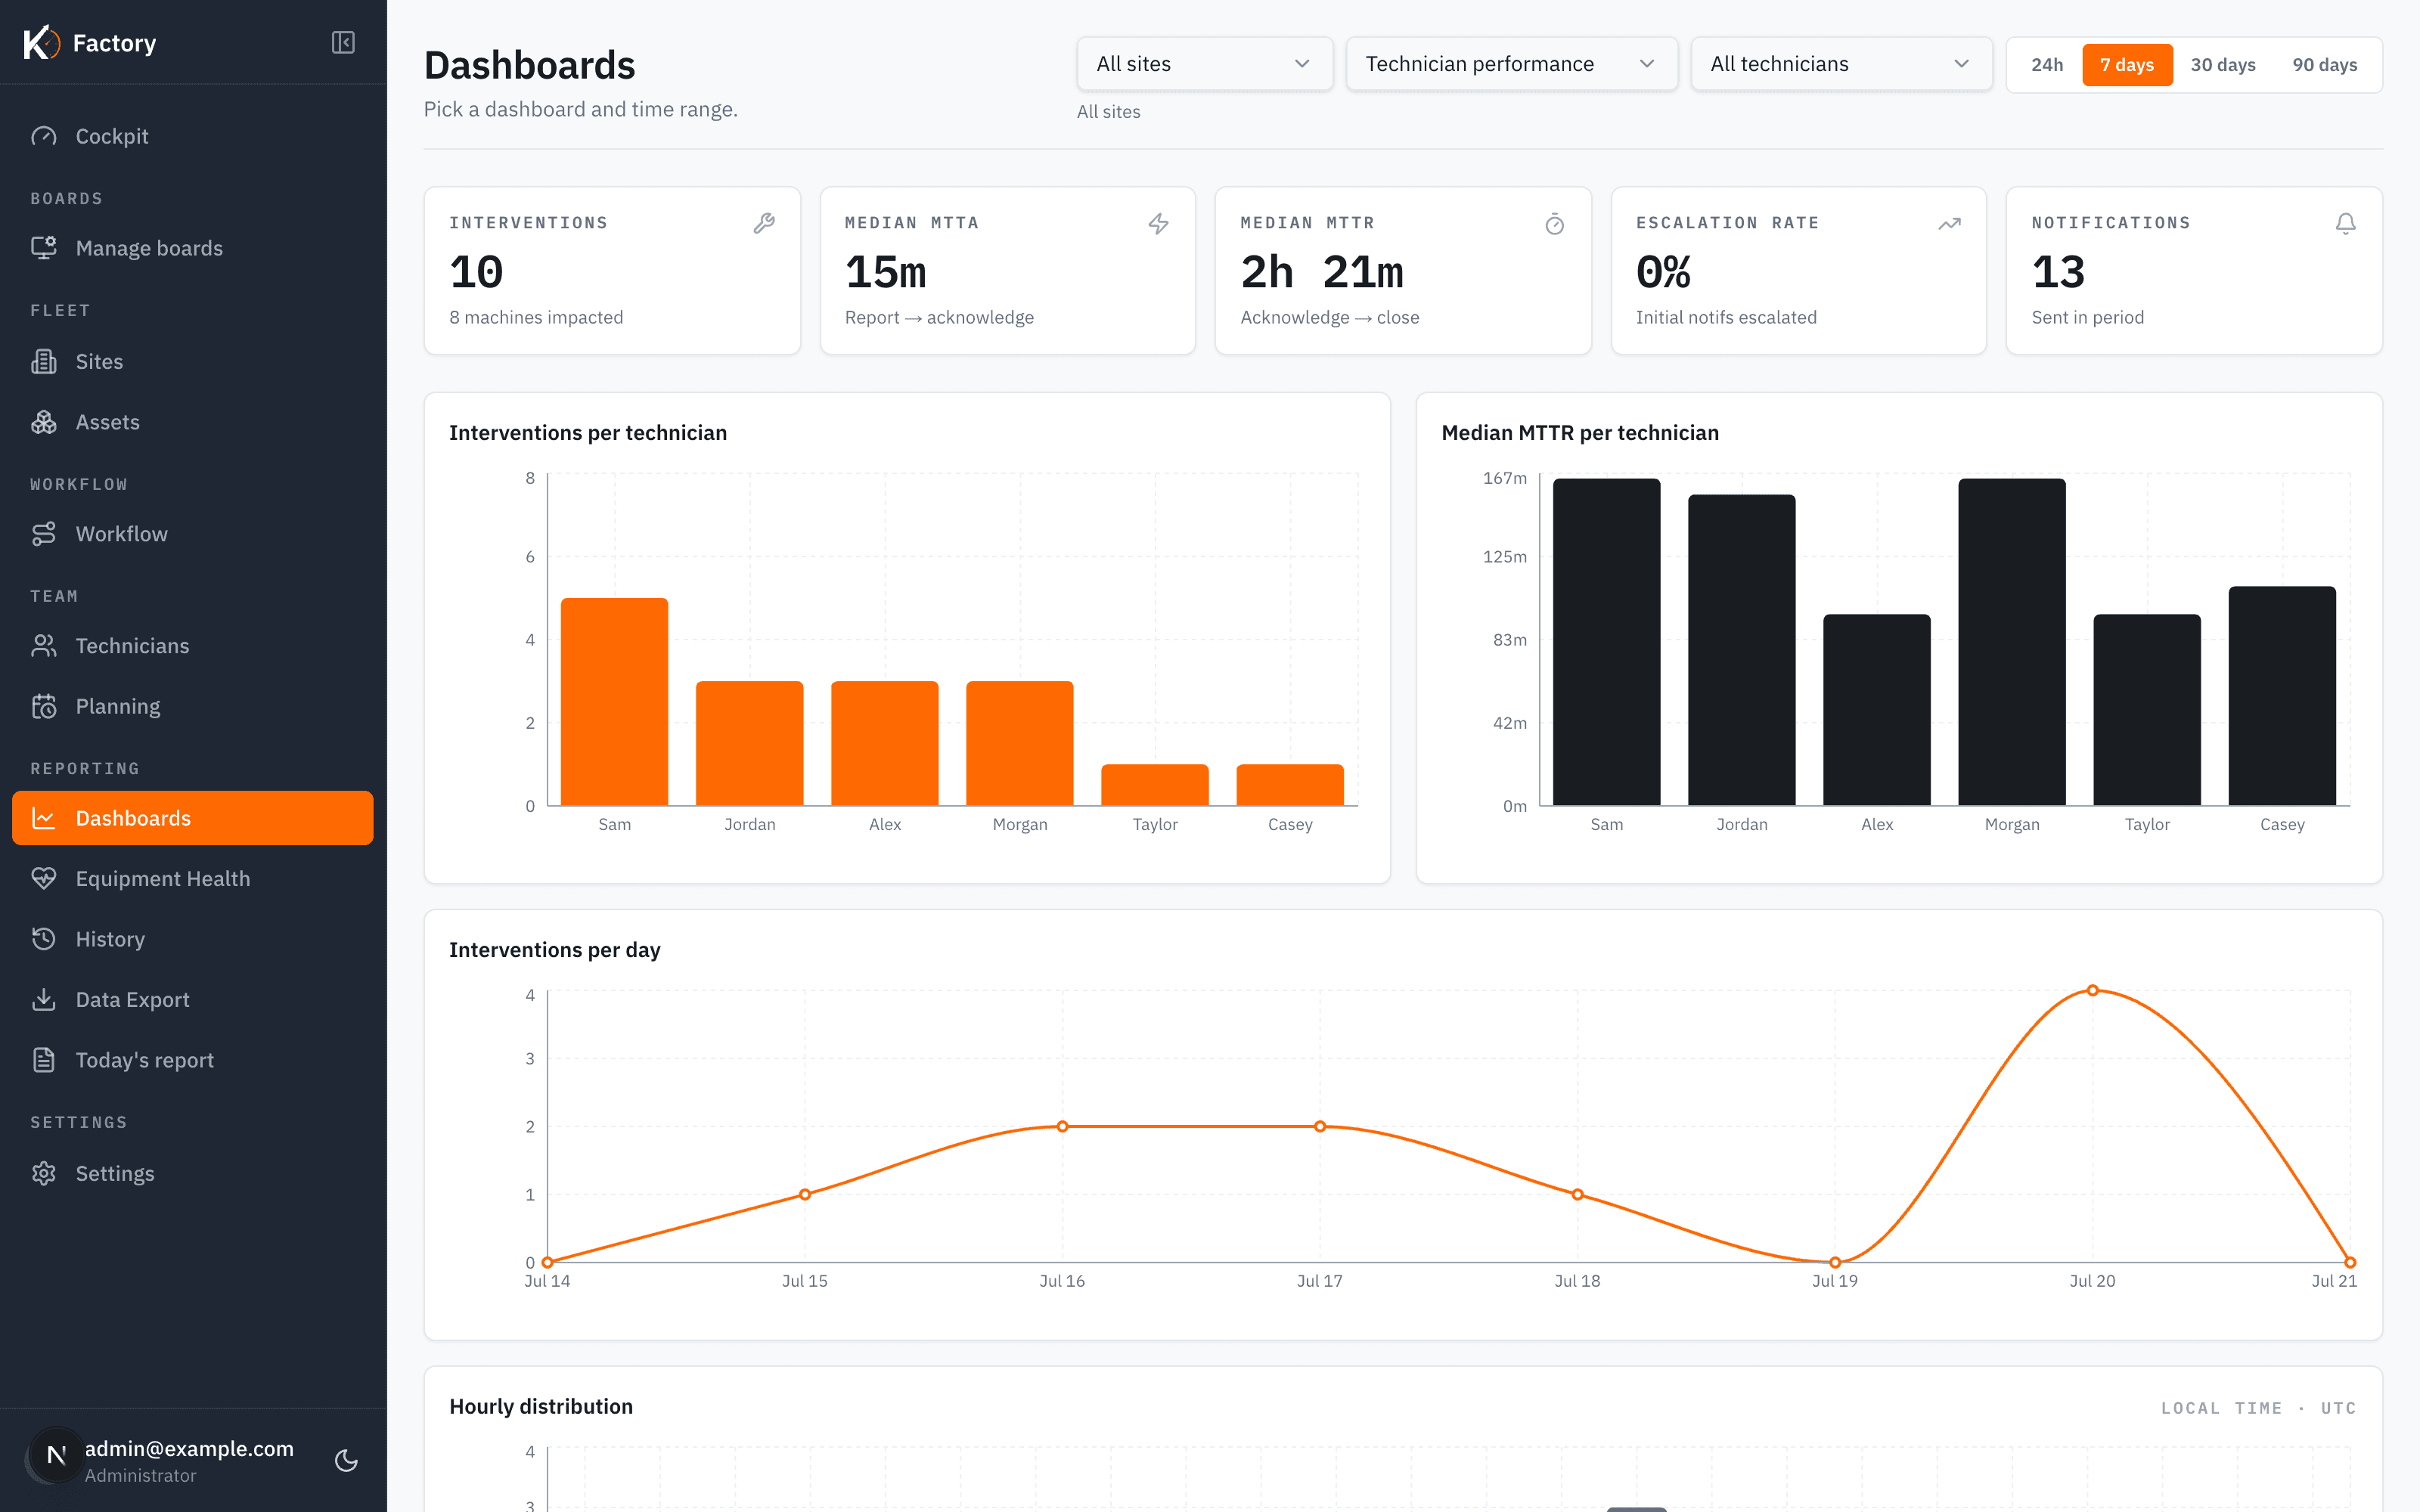
Every stop arrives already timed, attributed and categorised. Availability, MTTA and MTTR become a query instead of a monthly spreadsheet exercise.
Karios is not a CMMS. It sits underneath one.
A maintenance system of record is built around the work order: scheduled jobs, assets, parts, compliance. It is the right tool for that. It is also why downtime in most of them is something you reconstruct after a job is closed, rather than something you watch.
Karios turns that around. Live machine state is the primitive, derived from open repairs rather than a status column somebody forgot to update, and the work order comes out the other end. Close a repair and Karios can open and close the matching MaintainX work order and push the history to a Google Sheet.
If you already run a CMMS, keep it. Karios owns the ten minutes it was never designed to see: between a machine stopping and someone qualified standing in front of it.
It runs on the hardware already on your floor
The floor screens are built for Raspberry Pi touch panels and cheap wall displays on Chromium 92. Flat colours, no modern-CSS dependencies. You will not be buying rugged tablets to run this.
Operators do not need accounts
Machines, stations and wallboards sign in with a six-digit PIN on a scoped cookie. Technicians get a PIN. Admins get a password. Nobody pays a seat licence so an operator can press one button.
The data stays in your Postgres
One tenant, one database, pointed at infrastructure you choose. Every write goes through a server action with an authorisation guard, and the browser never touches the database.
It gets along with your CMMS
Closing a repair can open and close the matching MaintainX work order and push the history to a Google Sheet. Karios owns the real-time floor layer and leaves your system of record alone.
Questions we get.
- Is this a CMMS?
- No, and it is not trying to be one. A CMMS is a system of record for work orders, assets, parts and preventive schedules. Karios is the real-time layer underneath it: what is down right now, for how long, and who is on it. It records the repair and hands it to your CMMS. If you have no CMMS, the built-in history and reporting is usually enough to start with.
- What does the operator actually have to do?
- Two taps: the area of the machine, then the symptom. Both lists are yours and you edit them in settings. If a machine has no area breakdown configured, it is one tap.
- How does it decide which technician to page?
- It filters to technicians who are on shift at that moment, not on a break, not already assigned to an open repair, and who have push notifications enabled. If the machine has preferred technicians and any of them are available, it restricts to those. Among whoever is left it picks the person paged least often today, then the person paged longest ago. If nobody acknowledges inside your escalation window, everyone else still available gets paged.
- What happens if the network drops?
- Wallboards keep showing their last state and reload on an interval you set. Machine and station panels are rendered on the server, so a reload recovers the true state as soon as the connection is back. Nothing depends on a WebSocket staying up.
- Can we run it on our own servers?
- Yes. It is a standard Next.js application against a PostgreSQL database. Host it wherever you host things.
- How long does it take to get a plant running?
- The configuration is the work, not the software. Your zones, machines, categories, symptoms, problem types, closure checklist, technicians and their shifts all get entered in the admin UI. There is no hardcoded plant anywhere in the system. Wallboards and machine panels are a URL and a PIN.
- Does it do predictive maintenance?
- No. It measures what actually stopped, for how long, and why. That is the data any predictive effort needs first, and most plants do not have it cleanly.
- What does it cost?
- Per plant, not per operator. Tell us how many machines and wallboards you are looking at on the demo and we will give you a number.
Bring your worst machine.
Thirty minutes, screen shared, against your own zones, machines and shift patterns rather than a canned dataset. If it is not a fit we will say so on the call. This is a plant-floor system and it is not right for everyone.